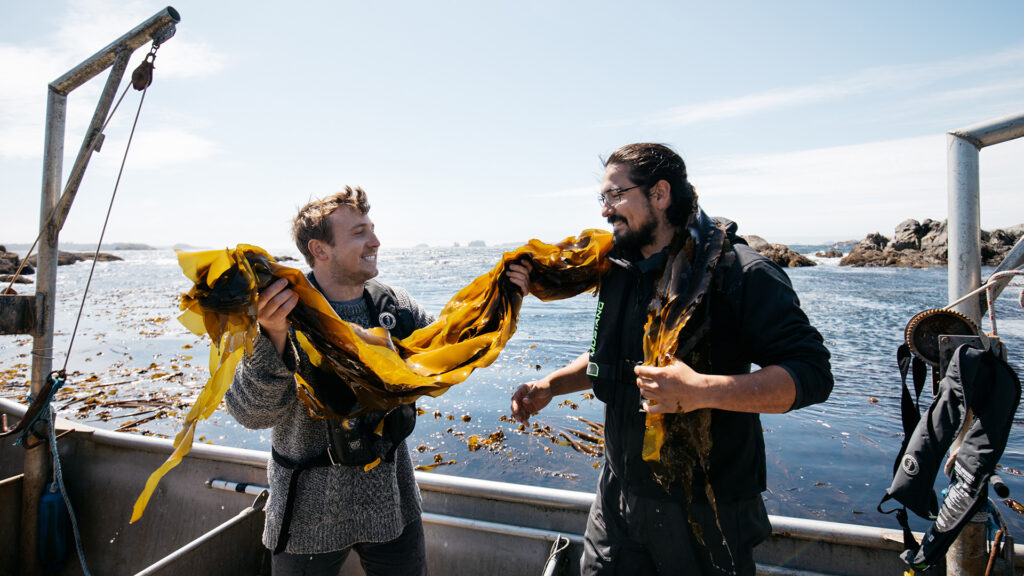
Rural advisors for Tahsis and Mowachaht Muchalaht First Nation focus on eco-tourism
“There are very few First Nation-led tourism businesses in the territory,” says Gauthier, “so we focused on developing partnerships with existing businesses. We want to help build their capacity. By creating packages, we can make it easier for visitors to experience this beautiful region.”
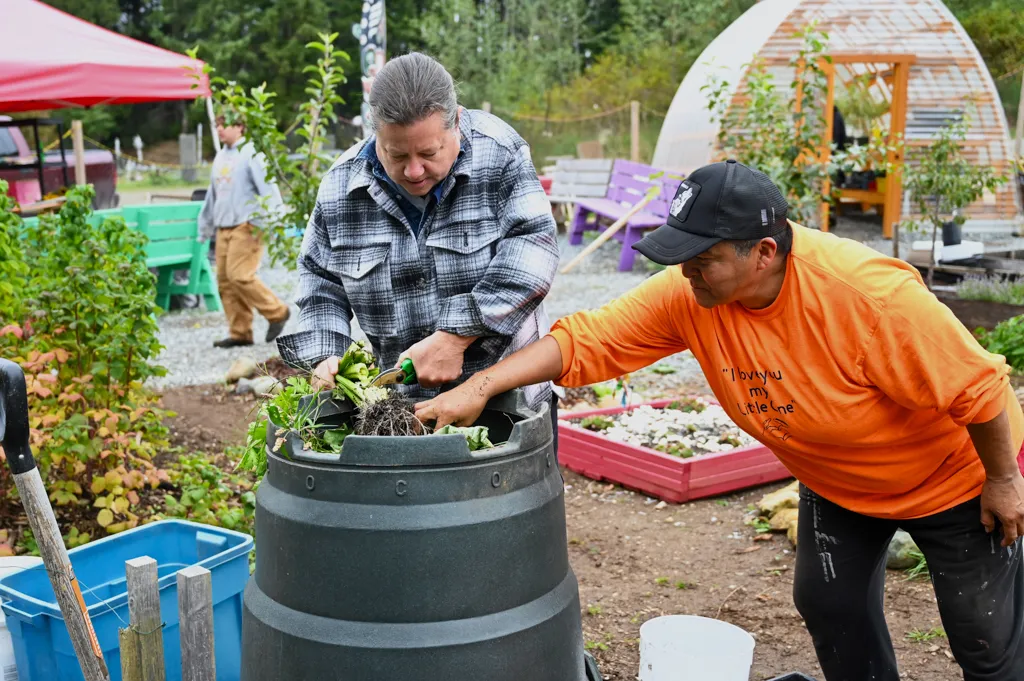
Creating a sense of place and food security in ’Yalis
You learn skills, you learn patience – things don’t grow quick, it takes time. You’re building up self-esteem, confidence, and getting them to have a good feeling of what it’s like to care for and feed your community.
How a shared kitchen is growing success for Comox Valley farmers and families
For more than 20 years, LUSH Valley has run healthy food programs and advocated for increased food security across the Comox Valley. In 2023, Lush Valley built a commercial kitchen in Courtenay’s Tin Town neighbourhood through an investment with Island Coastal Economic Trust.
We strategically invest in inclusive economic development, diversification, and innovation in partnership with communities across Vancouver Island, the Sunshine Coast, and island and inlets from the Salish Sea to Cape Caution.
Learn about how we empower communities and our regional impact in our latest Impact Report.